
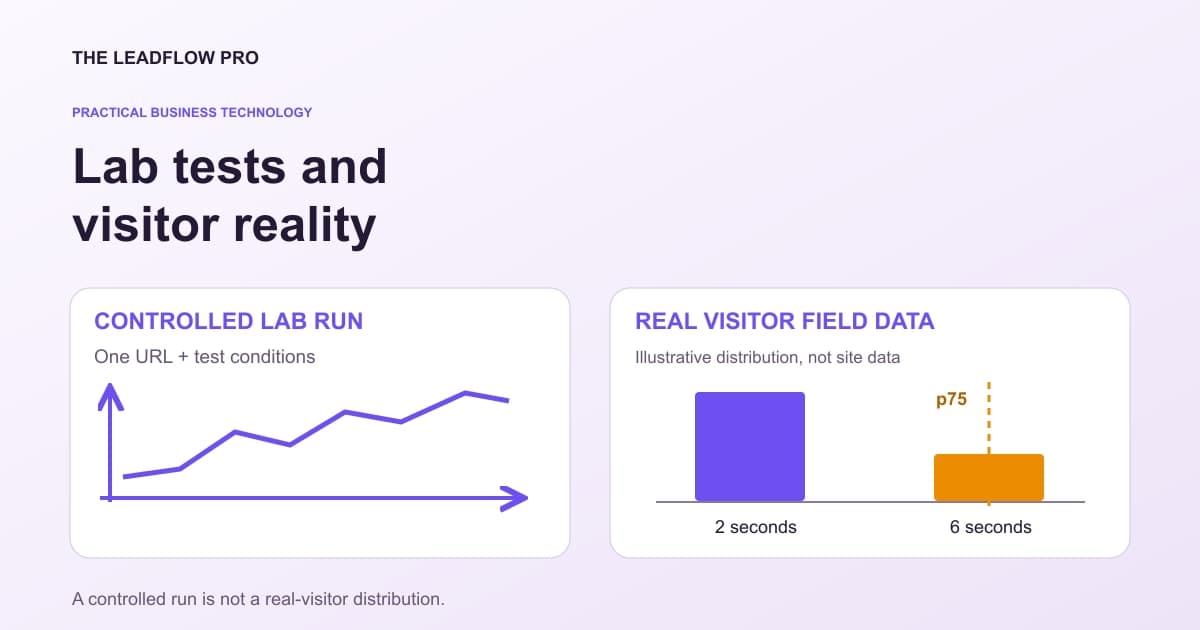
A website can score well in a controlled speed test and still feel slow to customers. A different run can score poorly while the real visitor trend is improving.
That does not automatically mean either report is wrong. They may be answering different questions.
Use a laboratory test to investigate a reproducible page load. Use field data to understand the experience of the visitors represented in that dataset. Then check whether people can complete the action the page exists to support.
Write the measurement conditions beside the number
"Mobile speed: 80" is not a complete measurement record. It leaves out the URL, test date, metric, connection assumptions and whether the result came from real visitors or a simulation.
Google describes PageSpeed Insights as combining controlled Lighthouse diagnostics with real-user data from the Chrome User Experience Report. Its field view covers a trailing 28-day period. When page-level data is insufficient, it may show origin-level data; if the origin also lacks coverage, field data may be absent. PageSpeed Insights data explanation
That distinction matters for a small business. A site-wide origin result may include pages with different content and visitors from the landing page you are fixing.
Copy this measurement sheet before comparing results:
PUBLIC URL:
Customer task on this page:
Measurement date and time:
Lab or field:
Tool and test conditions:
Mobile or desktop:
Exact page or whole origin:
Field collection window, if applicable:
LCP:
INP:
CLS:
Other diagnostic metric and unit:
Number of repeated lab runs:
What changed since the previous measurement:
Saved inquiry / checkout check:
Missing data or known limitations:
Next issue, owner and verification date:
Do not put visitor names, email addresses or calculator values in the URL you share for testing.
Use the right metric for the problem
Largest Contentful Paint concerns when the main visible content appears. Interaction to Next Paint concerns responsiveness to interactions. Cumulative Layout Shift concerns unexpected movement in the layout.
Those are different jobs. Compressing a hero image might help its loading cost while leaving a slow form interaction untouched. Reserving image space may reduce movement even if the download time barely changes.
Google's Web Vitals guidance evaluates these metrics at the 75th percentile, with mobile and desktop considered separately. Use the current metric definitions and thresholds rather than treating a single composite score as the customer experience. Web Vitals guidance
The practical question is specific: does the headline appear promptly, does the page stay steady and does the button respond when someone tries to act?
Do not hide the slow group inside an average
Here is an illustrative set of 100 measured visits. Seventy have a two-second measurement and thirty have a six-second measurement.
The mean is:
(70 × 2 + 30 × 6) ÷ 100 = 3.2 seconds.
Using the nearest-rank method, the 75th observation in sorted order is six seconds. The average looks more comfortable than the experience of the slower group.
This fictional arithmetic is not a Core Web Vitals report. It shows why recording a percentile, device segment and sample context matters. A small set of controlled runs also cannot replace a representative field dataset.
Change one useful thing
Start with the actual diagnostic evidence. An oversized image, unnecessary page-wide script or unreserved media box needs a different fix from a slow backend request.
Choose one issue, record the baseline and retain a rollback path. Repeat the same controlled test after the change. Then watch the relevant field trend as new observations enter the collection window.
A trailing multi-day dataset will not instantly become a clean measurement of yesterday's release. Avoid comparing one new laboratory run with a historical field period and calling the difference a proven improvement.
Do not remove useful labels, accessible controls, consent choices or the actual lead form just to improve a score. A fast page that cannot receive an inquiry fails its business job.
Treat revenue models as scenarios
A speed calculator can make assumptions visible. It cannot establish how many customers a particular page lost.
The tool below uses a deliberately simple retention curve. It is unvalidated and does not establish causation. Its "load time" is also a generic planning input, not a substitute for LCP, INP or CLS.
Keep revenue, gross margin and cash separate. If a model says a hypothetical change might create an extra $1,000 in sales, delivery costs and overhead still exist. If the visitor conversion denominator is wrong, even that sales scenario can be misleading.
Explore a speed assumption after taking real measurements
This calculator uses an arbitrary, unvalidated retention curve. It cannot measure lost sales or tell you how much a speed change will earn.
Your numbers
What that means
Based on your inputs and any starting examples. This calculation does not fetch live rates or market benchmarks.
Measure your page on representative mobile connections. Identify the slow resources, change one issue, and compare real measurements.
Illustration only: the arbitrary curve removes nine percentage points of retention per second beyond one second, with a 25% floor. It is unvalidated and cannot establish lost sales or causal improvement. Conversion is applied to retained visitors, so do not enter a site-wide conversion rate without adjusting its denominator.
What this assumed
- Uses an arbitrary, unvalidated retention curve for illustration. It does not measure actual abandonment, conversions or lost sales.
Calculations run in your browser. Choosing Email my result saves an excerpt and your contact details with The LeadFlow Pro so we can email it to you.
This is an estimate
This tool returns an estimate based on the numbers you entered. Your real result depends on your own costs, rates and conditions. Check it against your own records before you make a decision with it.
How to run it, step by step
- 1Keep measurements separate. Record your measured metric, device and data source. The calculator's generic load-time input is not interchangeable with every Core Web Vital.
- 2Use a consistent denominator. Visitors who contact you is applied to modeled retained visitors. Do not insert a site-wide rate without understanding that denominator.
- 3Compare a scenario, then validate. Enter your assumptions and compare the two-second model. Check actual form completion and customer outcomes after a real change.
How to read what it gives you
- The model subtracts nine percentage points of retention per second beyond one second, with a 25% floor. That is an illustration, not a published causal finding.
- Customer value is revenue, not margin or available cash.
- A better laboratory score does not establish better real-world conversion.
The tool is free, it does not expire, and you can put it on your own website if you want it there. Nothing on this page is locked.
Not ready to talk? Browse the rest of the free tools
Verify the path after the page loads
After a change, use a phone to reach the page, read the main offer, open the relevant tool or service and check that the contact action is available.
If an authorized controlled form test is part of release review, verify its saved record and receiving destination separately. A speed test does not test those systems.
Google's people-first content guidance asks whether a page provides original, useful value. A good score cannot substitute for answering the visitor's question. Google's helpful-content guidance
Ask LeadFlow to review a business website. Bring the public URL, the measurement sheet and the customer action that matters. The goal is a usable, measurable page, with speed improvements supported by evidence rather than a ranking or revenue guarantee.
Questions people actually ask
Why can PageSpeed show a good lab result and worse real visitor data?
The controlled test and the field dataset cover different conditions and time windows. Check device, page versus origin scope and the field collection period before comparing them.
Does no field data mean the page is fast?
No. There may not be enough eligible data. Use controlled tests and appropriate first-party measurement while clearly labeling the missing coverage.
Does speed guarantee Google rankings or more sales?
No. Speed is one part of the experience. Relevance, useful content, a working inquiry path and the quality of the offer also matter.
Where these numbers come from
- Google: PageSpeed lab and field data, collection period and fallback (2026-11-01)
- web.dev: Core Web Vitals and the 75th percentile (2026-11-01)
- Google: people-first content rather than ranking manipulation (2026-11-01)
Our own figures come from the lead records of businesses we run systems for, counted in total and never by name.